Feature · Astrocartography

Relocation work that survives the session.

Astrolium maps planetary lines, parans and power zones for a saved client, ranks places by life area, compares up to five pins and saves the study.

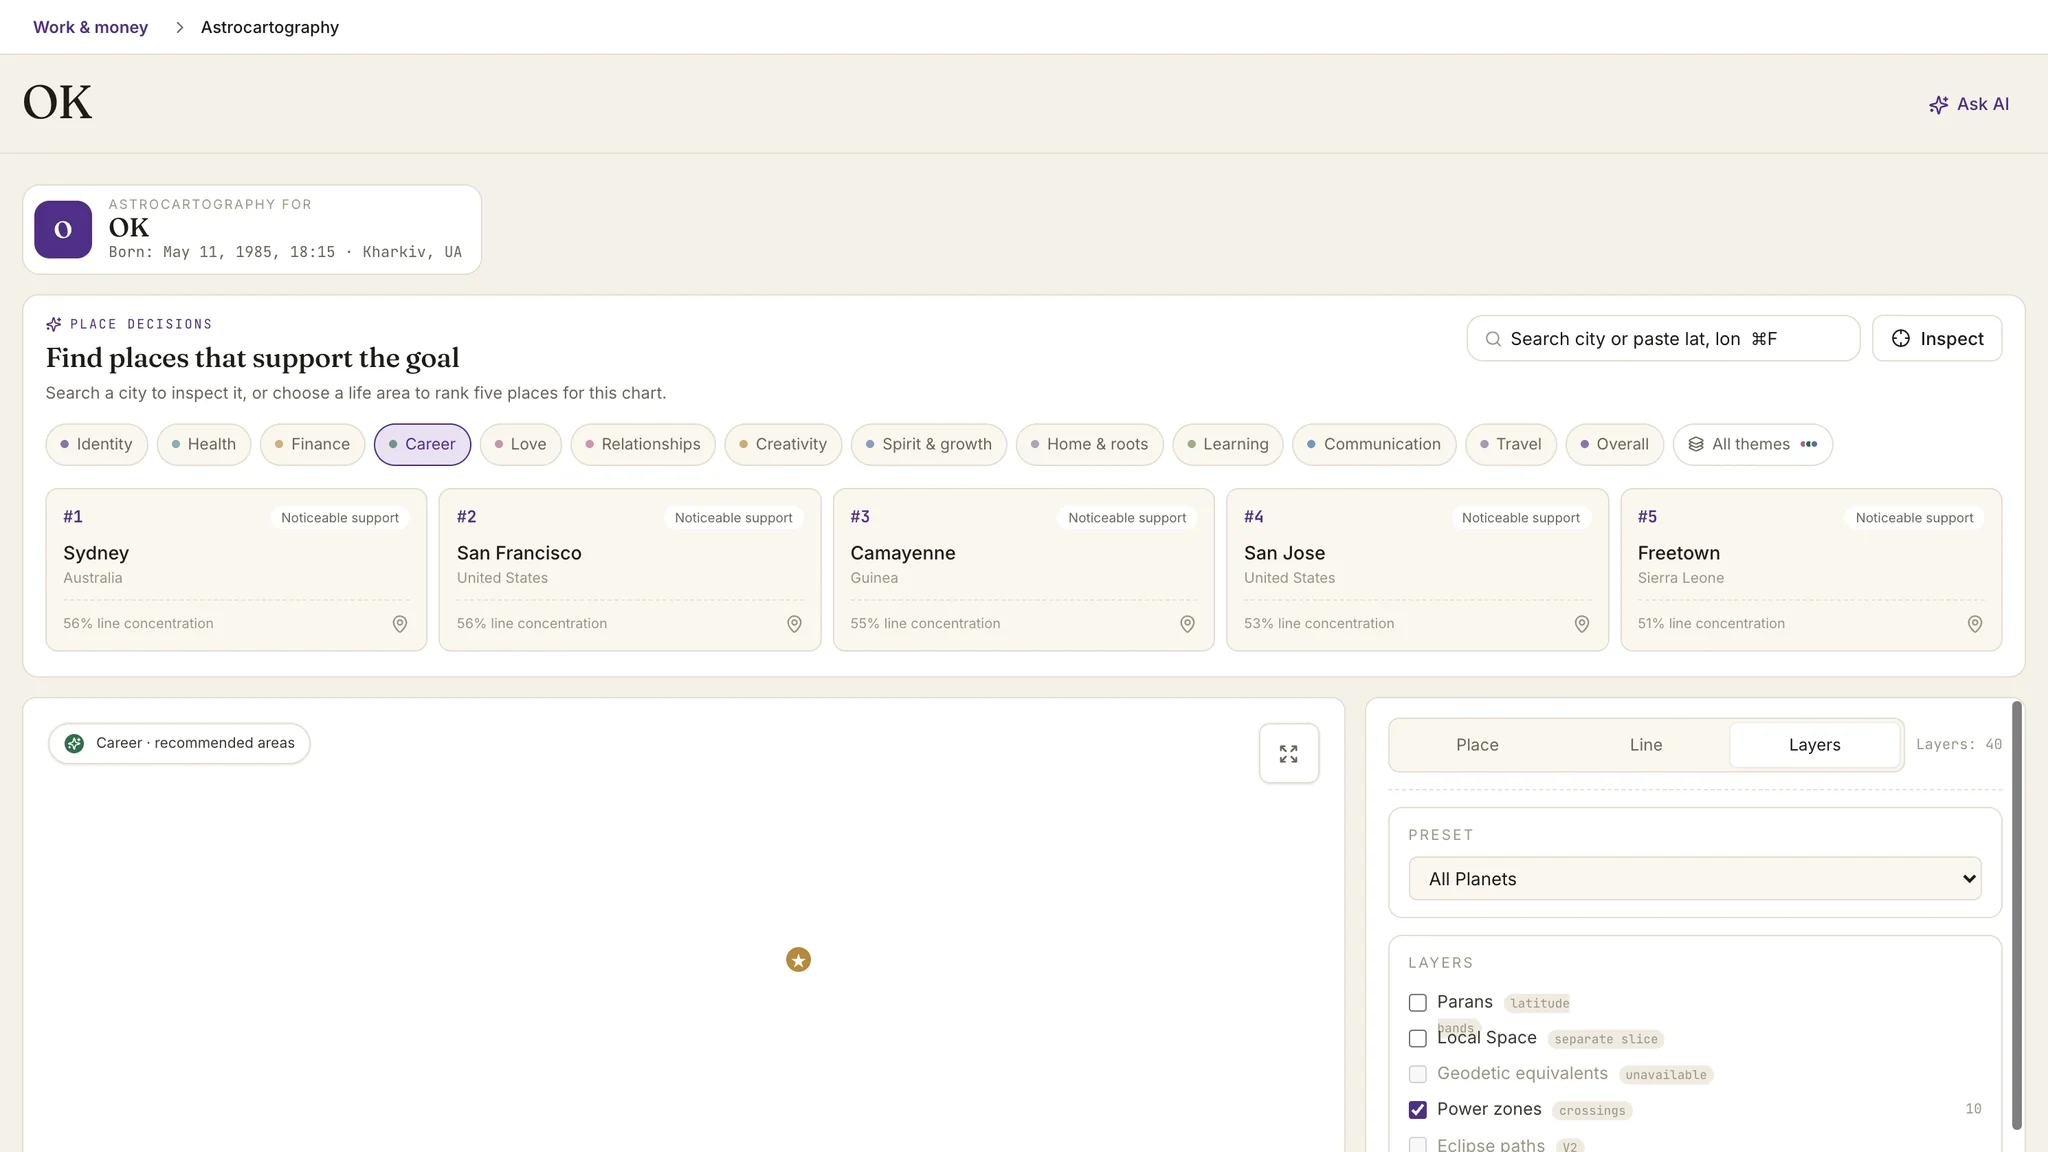
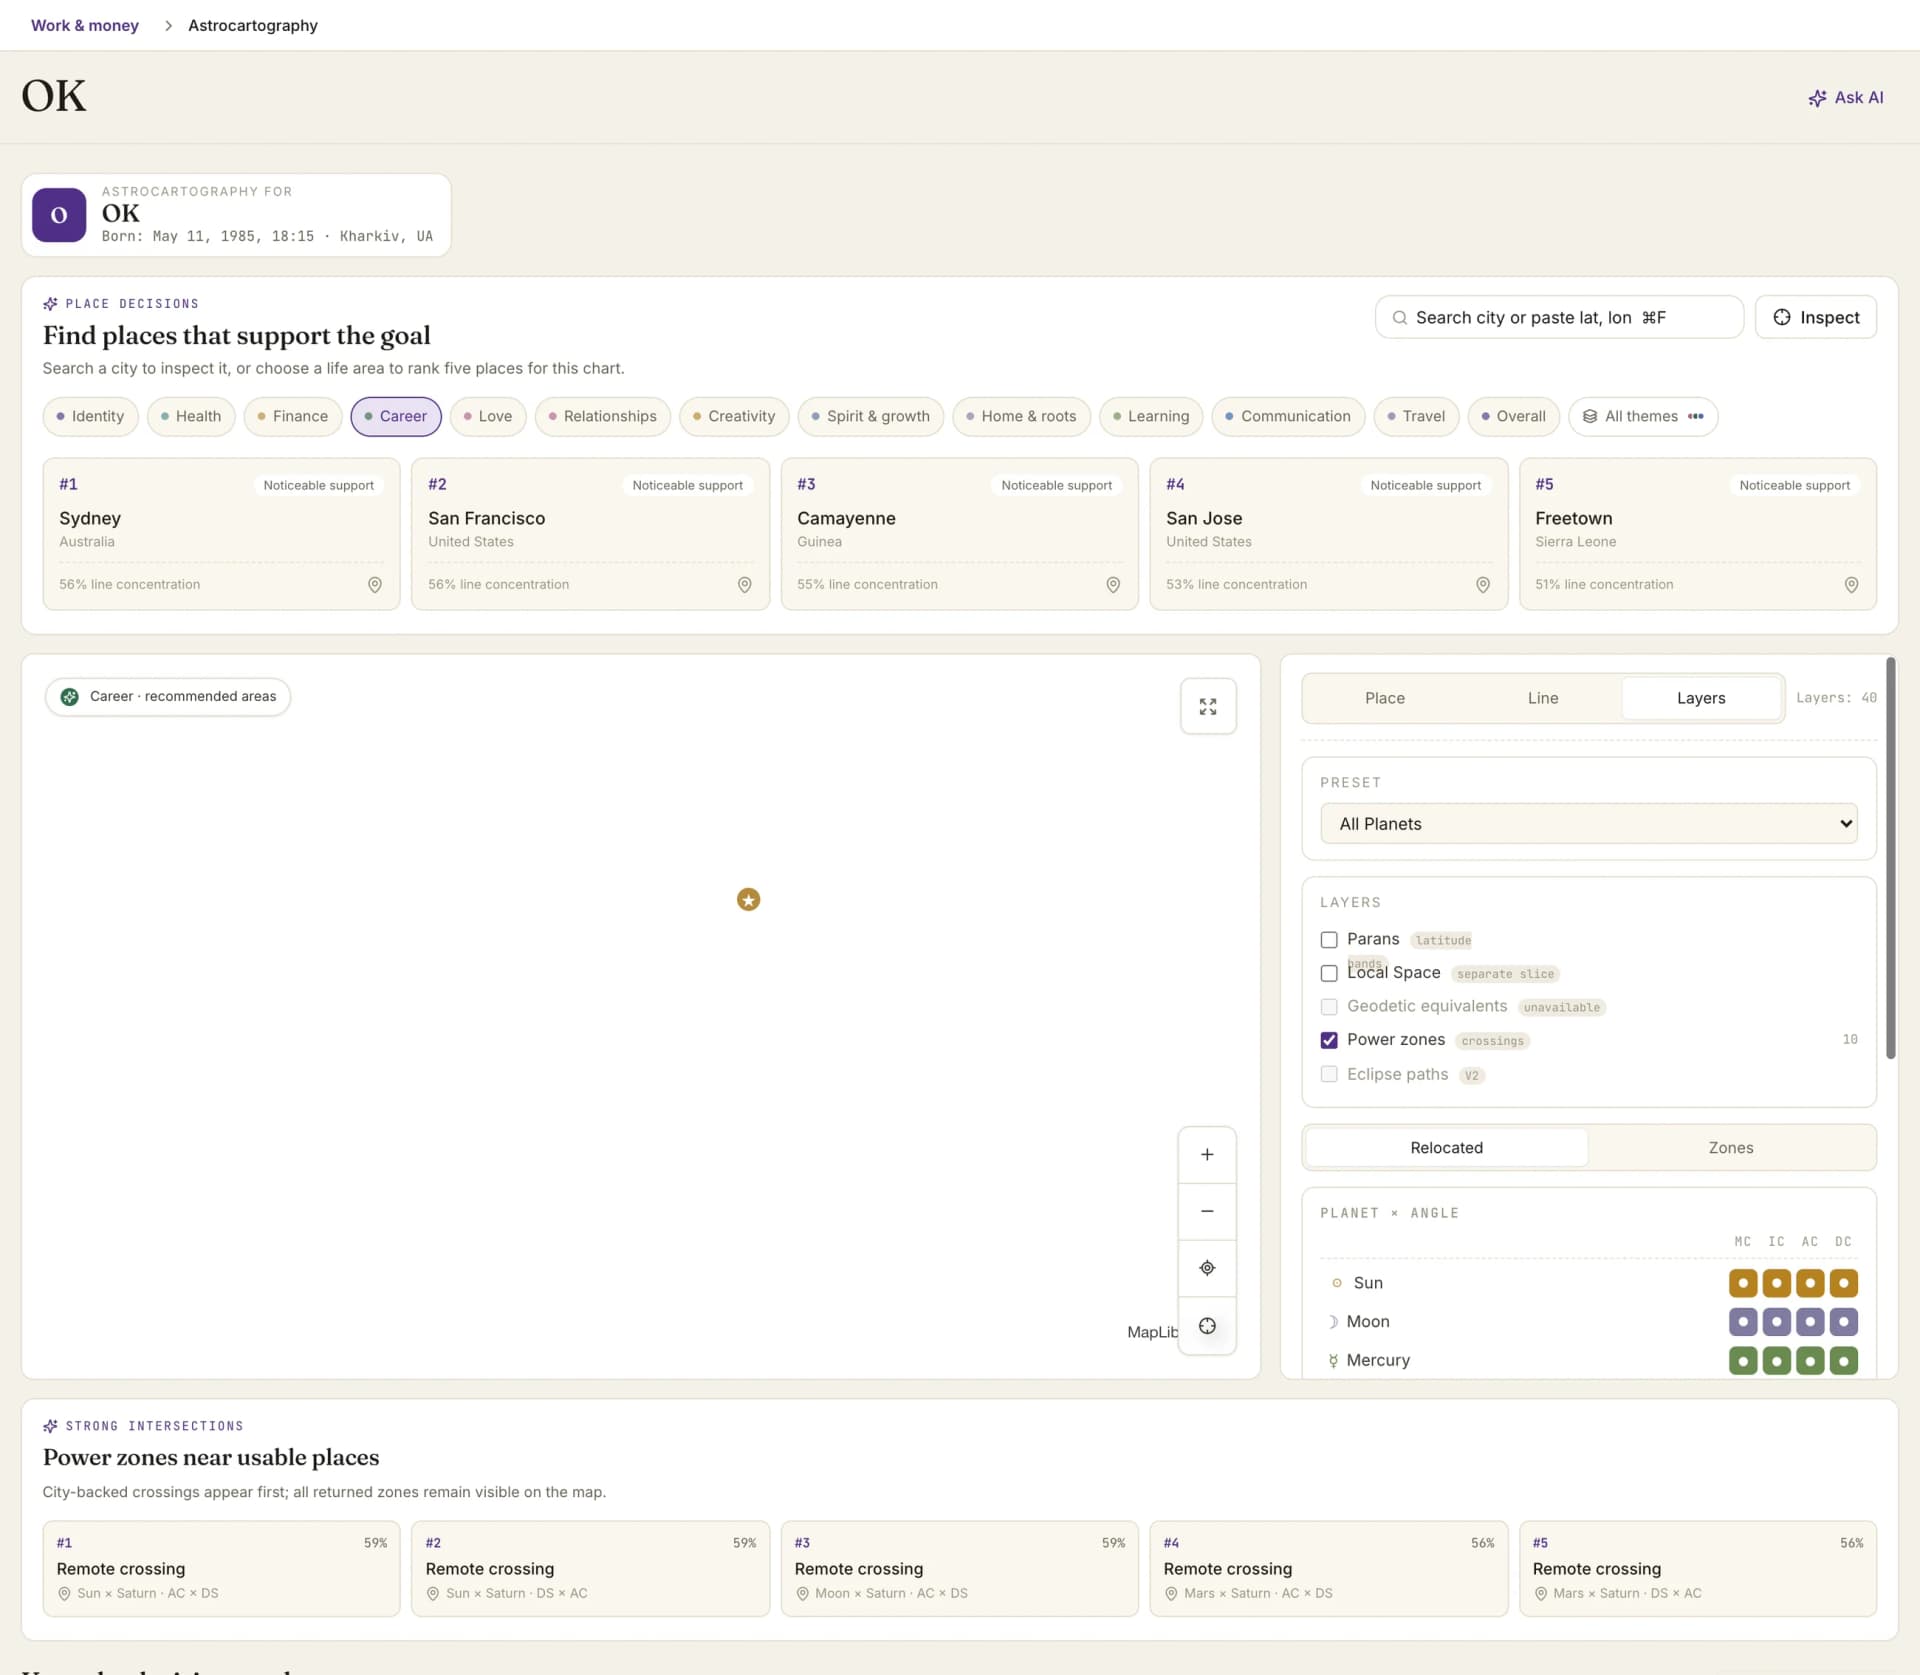
Astrocartography decisions: the goal picker and ranked places that support it

By Oleg Kopachovets · Updated September 16, 2026

01

Free line maps answer one question for one anonymous chart and forget it the moment the tab closes.

02

A relocation conversation runs over several sessions, and nothing in most tools holds the work between them.

03

Line maps show where lines are, not which places are worth discussing for the goal the client came with.

04

Astrodynes are usually printed without saying which house system produced them, which quietly changes the numbers.

Capabilities

What you can do with our astrocartography software

Map-first workspace

A real vector map with planetary lines for the selected bodies and angles, paran latitude bands, eclipse paths and a Local Space slice. Presets cover benefic lines, challenge lines, angle-only views and career or relationship focus.

Places ranked by life area

Choose a life area from thirteen, from career and finance through home, learning and travel, and the map ranks places for that chart. Support levels read strong, noticeable, local or subtle rather than as a verdict.

Power zones and line intelligence

Crossings are returned as zones with a radius, city-backed ones first. Click a line for its geometry, latitude sweep, whether it crosses land, global strength and local influence, with the delineation shown as received.

Compare places side by side

Drop up to five pins, compare them by life area in one matrix with the best cell per row highlighted, and export the comparison as CSV for the client to keep.

Astrodynes with the method printed

Power and harmony stay separate measures, never merged into a place rating, and the method line names the house system behind them. Equal-house and polar-region caveats are printed where they apply.

Saved studies become documents

Save a place or a comparison with a status such as considering, career or avoid, add a practitioner note, reopen it weeks later, and turn it into an editable client report built only from the saved facts.

How astrocartography software works in Astrolium

  1. Step 01 / 03

    Open the map for a client

    Birth date, time, coordinates and time zone come from the saved record. Choose the planets and angles you want drawn, or start from a preset.

  2. Step 02 / 03

    Inspect places and lines

    Search a city or click anywhere for a support profile, life-area ratings and nearby lines with their distance and orb. Click a line for its technical readout.

  3. Step 03 / 03

    Save the study, then write it up

    Keep a place or a five-pin comparison as a saved study with your note, and generate a client report from it when the conversation is ready for one.

In the app

The real astrocartography software screen, not a mockup

Astrocartography decisions: the goal picker and ranked places that support it

Astrolium's astrocartography workspace attaches relocation work to a client, not to a browser tab. Lines, parans, power zones, ranked places, Astrodynes and saved studies sit on one map that remembers what you decided last time.

For a quick anonymous look, the astrocartography map and the relocation chart calculator are free. For the technique, read the astrocartography guide.

What the workspace holds

Astrolium's astrocartography module is a map-first workspace built on a saved client record. It draws planetary lines for the bodies and angles you select, paran latitude bands, power zones where lines cross, eclipse paths, and a separate Local Space slice of directed azimuths from the birthplace. Click any place for a support profile, ratings across thirteen life areas and its nearby lines with distance and orb; click any line for its geometry, latitude sweep, global strength and local influence. Up to five pins compare side by side in a matrix that exports as CSV. Astrodynes report power and harmony as separate measures with the house system named. Studies save with a status and a practitioner note, reopen weeks later, and convert into an editable client report assembled only from the facts you chose to save.

Relocation questions arrive as conversations, not as single calculations. A client is weighing three cities, or one city against staying put, and the discussion runs across several sessions with new information each time. A map that forgets everything at refresh is the wrong shape for that work.

The map, and what is on it

Lines are drawn for the planets and angles you choose, with presets for the common cases: benefic lines, challenge lines, all planets, MC and IC only, AC and DC only, career focus, love and relationships. Solid lines mark MC and AC, dashed mark IC and DC. Line opacity and influence bands are adjustable, because a map with everything switched on is a decoration rather than a tool.

Other layers sit beside the lines. Parans render as latitude bands. Power zones mark where two lines cross, each with a radius, and city-backed crossings are listed before remote ones so the list stays usable. Eclipse paths can be overlaid. Local Space is kept deliberately apart as a professional slice: directed azimuths from the birthplace, with altitude above or below the horizon, a cardinal call only inside 2 degrees of true cardinal, and a warning for circumpolar points.

Place analysis

Click anywhere, or search a city, and the inspector fills. You get a location score expressed as line concentration, which the panel labels as line concentration rather than a quality-of-life rating. Under it: support ratings by life area with the strongest and weakest named, and the nearby lines with their distance and orb.

That detail carries the reading. A line 340 km away with a 1.8° orb is a different proposition from one running through the middle of town, and the list makes the difference legible instead of leaving it to a colour on a map.

The Where should you live panel goes the other direction. Pick one of thirteen life areas and the module ranks places for that chart, showing the theme map as a gradient that follows relative rank rather than desirability.

Astrodynes, with the method attached

Power and harmony are reported as two measures and kept that way. The panel prints the method line, including the house system, which matters more than it might seem: the same chart scores differently across house systems, so a number without its system is not a number you can quote. Two caveats print themselves where relevant, one for equal-house systems and one for the polar substitution the ephemeris service applies above the polar circle.

House systems throughout Astrolium come from the same set of 23 systems, so the astrocartography numbers reflect the frame you already work in rather than a hidden default.

Comparisons and saved studies

Drop up to five pins and the comparison matrix lays them out by life area, highlighting the best cell in each row, with a CSV export for the client.

Saved studies are the part that makes this a workspace. Save a place or a comparison with a title, a status from considering, career, love, healing, avoid or visited, and a practitioner note. Reopen it 2 weeks later when the client has new information. When the conversation is ready for a document, generate a client report from the study: place overview, support by life area, nearby lines, comparison and your note, assembled from the saved facts and then editable.

What it will not do

A few limits to know before you lean on the map.

Geodetic equivalents are not drawn. The verified calculation contract does not expose them, and the module says so on screen rather than approximating a layer and letting it look authoritative.

Line concentration is not a life rating. It counts how much line activity falls near a place. A city can carry heavy concentration and still be somewhere the client should not move, and the panel labels the number accordingly.

Nothing here decides anything. Ranked places, support levels and Astrodynes are inputs to a conversation between a practitioner and a client who has a job, a family and a visa situation the chart knows nothing about.

For the paran technique specifically, see the parans guide. For power zones as a standalone free calculation, use the power zones tool. For plan detail, pricing.

Frequently asked questions

How is this different from the free astrocartography calculators here?
The free tools draw lines for one set of birth data and hold nothing. The workspace attaches the map to a client record, ranks places by life area, compares up to five pins in one matrix, keeps saved studies with your own notes and a status, and turns any study into an editable client report. The [free map](/tools/astrocartography-map) stays the right tool for a quick look.
Which plan includes astrocartography?
The module sits on Pro, at $11 per month, and every tier above. One panel inside it, the relocated chart inspector that shows natal-to-relocated angles and house changes for a pinned place, is a Master-tier panel in a practice workspace. Astrolium Personal includes the relocation chart for your own chart. Everything else described here comes with Pro.
What house system do the Astrodynes use?
The one you configured, and the method line on the panel names it rather than leaving you to guess. Two caveats are printed where they apply: Astrodynes were normed on unequal houses, so under an equal system house strength no longer distinguishes a wide house from a narrow one, and above the polar circle the ephemeris service substitutes an equal-house system, so scores there may not use the houses you requested.
Does it do parans, Local Space and geodetic lines?
Parans appear as latitude bands on the map, and Local Space is a separate professional slice showing directed azimuths from the birthplace, with a 2° threshold for calling a direction cardinal. Local Space stays anchored to the birthplace and does not move when you inspect another city. Geodetic equivalents are not exposed by the verified calculation contract, so Astrolium does not draw them rather than inventing a layer.
What happens when the birth time is unreliable?
Relocated angles and house changes are the birth time, so with no time on file or an unreliable Rodden rating that section is suppressed and the reason is stated on screen. The line map itself still draws, because planetary lines depend on the moment rather than on the recorded minute in the same way. Nothing is computed from a substituted noon and presented as verified.

Get Relocation work that survives the session. as part of Astrolium

One subscription covers every feature. 5 free client profiles, no card required.